ADMISSIONS
-
Course Details
12 July, 2025
6 weeks Online
Sunday - 10:00 a.m. to 5:00 p.m
-
Program available in
Mumbai
-
Eligibility
Completed grade 12 or higher
-
Admission Process
Submit this application form to enrol. You will be contacted within 2 working days

SHORT-TERM PROGRAM Data Design
Transform data into relevant, readable infographics and visual creations.
Data Design training teaches you how to transform data into relevant and readable infographics, allowing you to effectively communicate complex information in a visually captivating way.
Useful tools for informing, sending a message or promoting, data must be presented in an accessible manner to unfold their potential.
Data visualization is used to give them meaning by processing data and defining a graphic concept.
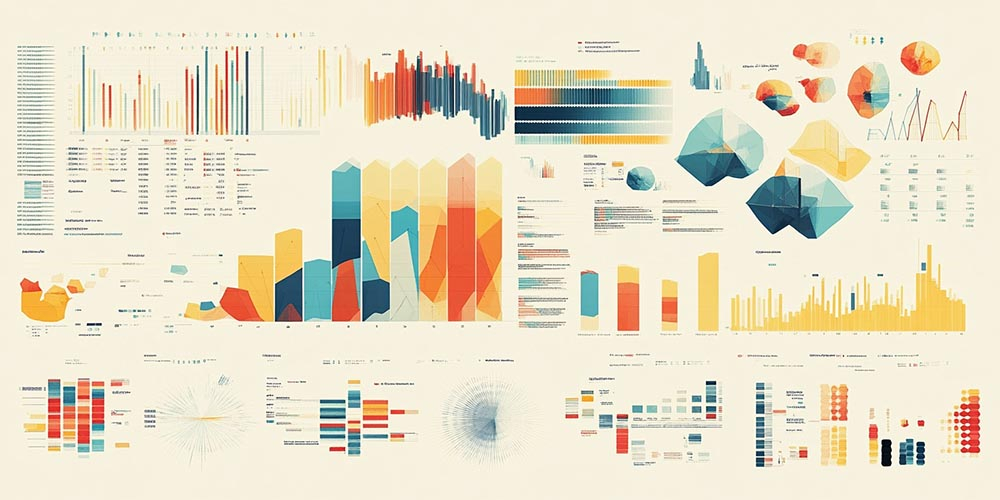
To bring a set of data to life, our certified module will teach you to translate them in a visual and inventive way through different data visualizations: treemaps, maps, histograms, diagrams, symbols, visual scenarios, etc.
The Data Designer training offers an exceptional opportunity to master the art of data visualization. By learning to transform raw data into relevant infographics and visual creations, you will develop the ability to give meaning to information through a well-defined graphic concept.

GLOBAL LEARNING

PRACTICAL TRAINING

EXPERIENCED MENTORS
Curriculum
MODULE 1: INTRODUCTION AND GENERAL PRESENTATION
- The necessary ingredients
- Methodology and steps to follow
- Data storytelling and data motion
- Collective discussion

MODULE 2: DATA PROCESSING
- Discover techniques for collecting data (spreadsheets: Excel, Google Sheet, and other open source tools)
- Extract, analyse, sort, classify and organise data and understand constraints
- Exercise and collective discussion

MODULE 3: KNOW HOW TO CHOOSE THE RIGHT GRAPHIC FORM FOR DATA
- Handling of tools, research and test several possibilities and make a critical and reasoned choice
- Exercise and collective discussion
MODULE 4: OPTIMISE READING SO AS NOT TO LOSE THE READER
-Measuring the limits of interpretation and simplification. Know and describe good practices and mistakes to avoid
- Collective discussion

MODULE 5: THE EDITORIAL ASPECT
- Define and identify an angle
- Prioritise and contextualise information
- Collective discussion